Grow with Google
Editorial Team

Data analytics is the practice of interpreting data to uncover patterns, trends, and insights that can drive better decisions or generate predictions. The process of analyzing data involves using various techniques and tools to clean, manipulate, and analyze raw data, turning it into valuable information.
Editorial Team
By clicking subscribe, you consent to receive email communication from Grow with Google and its programs. Your information will be used in accordance with Google Privacy Policy and you may opt out at any time by clicking unsubscribe at the bottom of each communication.
Link to Youtube Video (visible only when JS is disabled)
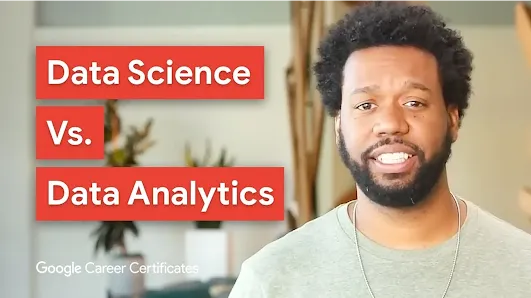
Although they are commonly mixed up, the roles of a data scientist and a data analyst are very different.

Link to Youtube Video (visible only when JS is disabled)
Understanding business context is key in data analysis, and a non-traditional background can offer valuable perspective when starting your career.
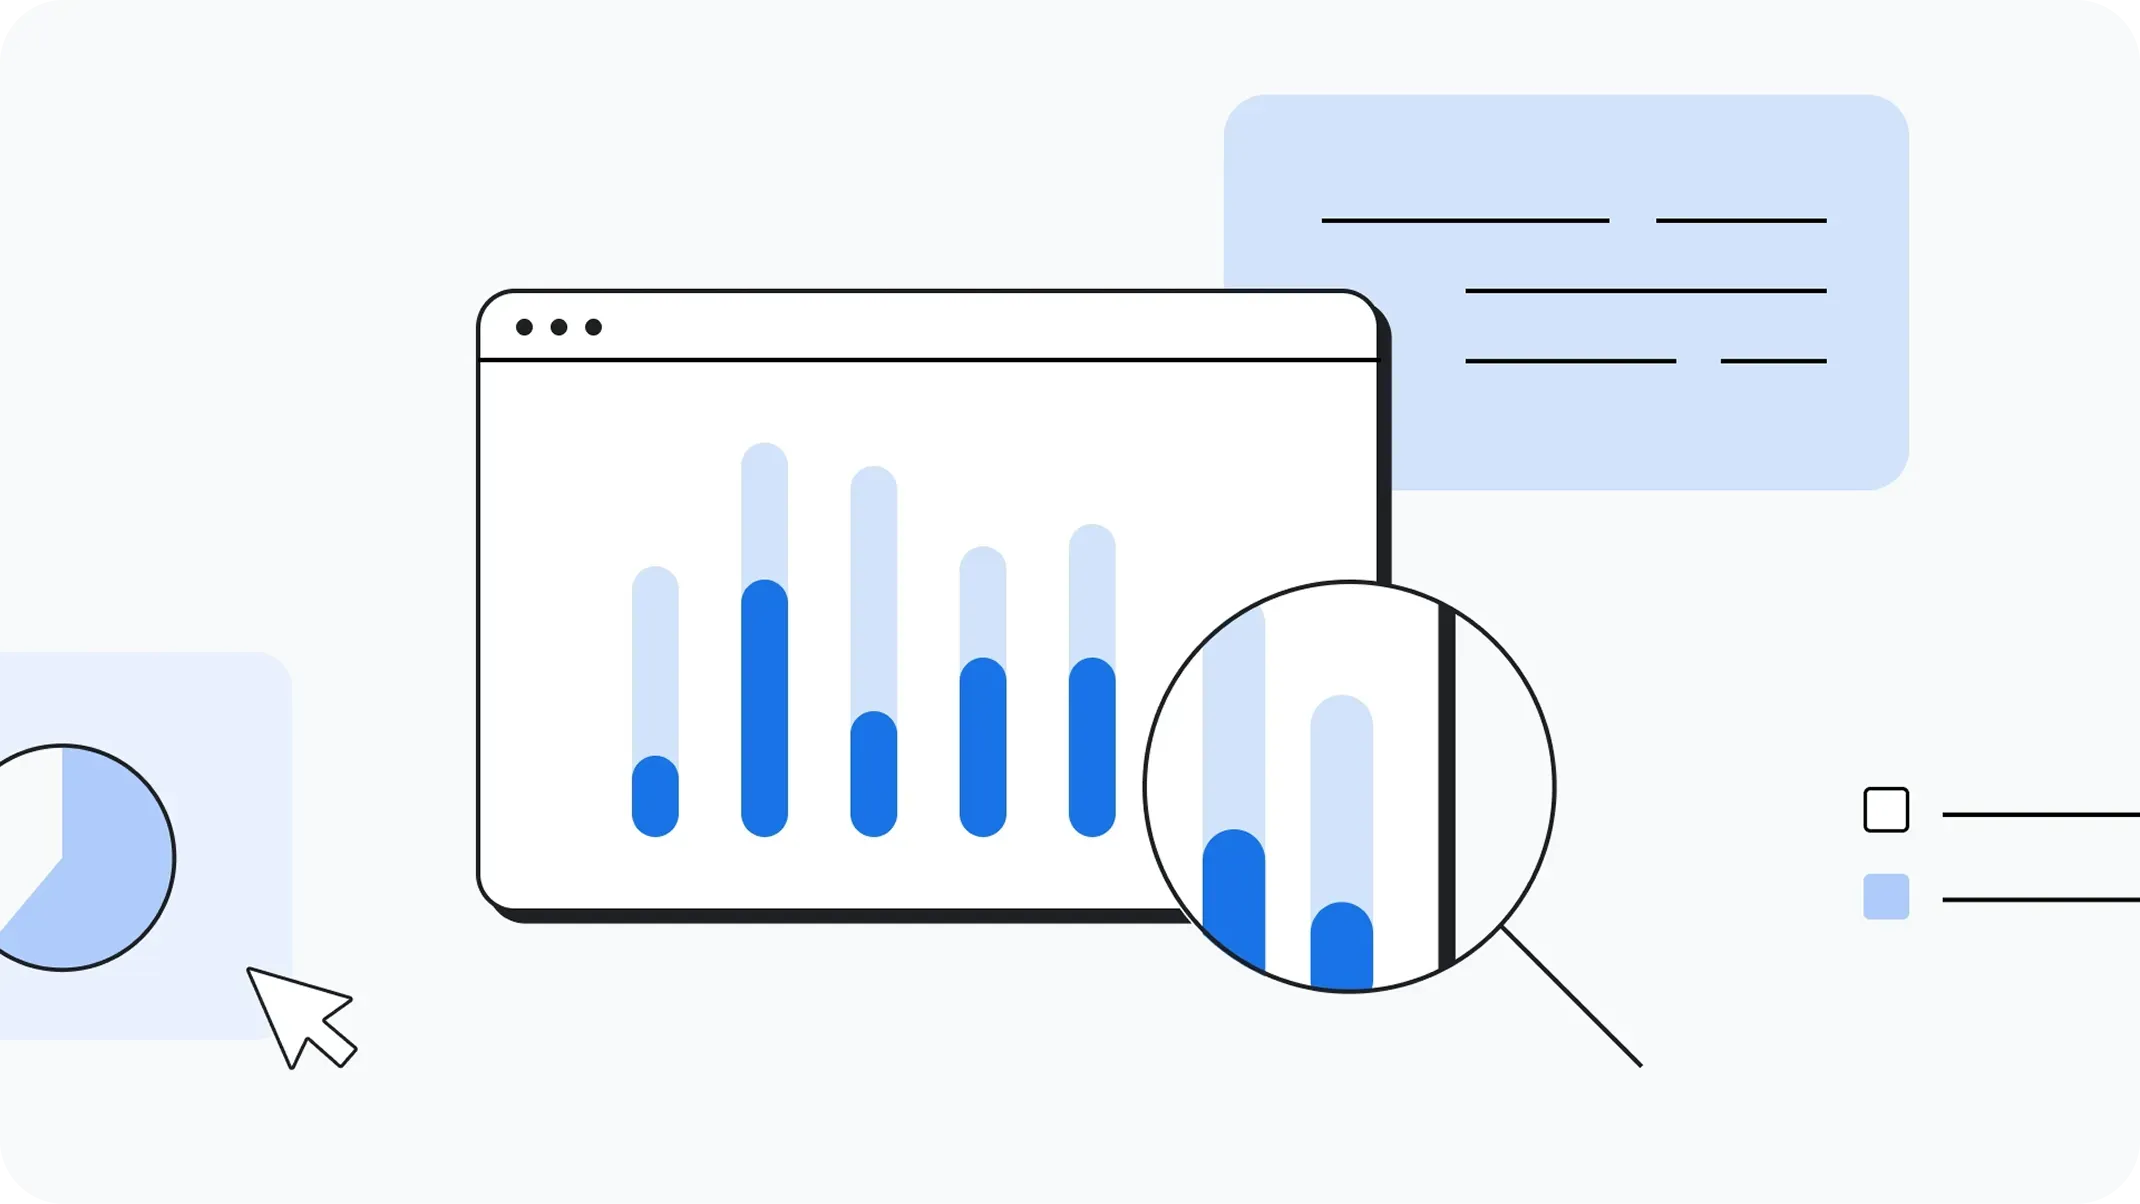
Google Data Analytics Certificate
Learn the foundations of data analytics, and get job-ready skills to kick start your career in a fast-growing field.
Get a taste of data analytics
Take a peek into our data analytics certificate, and get an overview of the field as a whole.
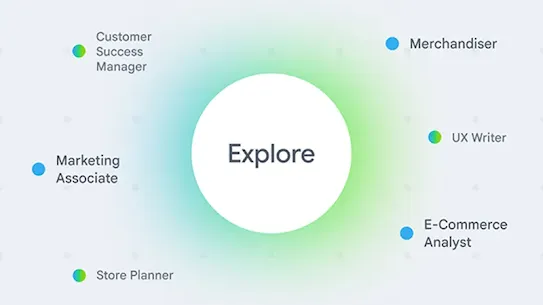
Career Dreamer
Discover how your unique life experiences can translate into valuable skills that employers need.
Interview warmup
Practice answering real questions and get personalized feedback from AI that analyzes your responses.
By clicking subscribe, you consent to receive email communication from Grow with Google and its programs. Your information will be used in accordance with Google Privacy Policy and you may opt out at any time by clicking unsubscribe at the bottom of each communication.